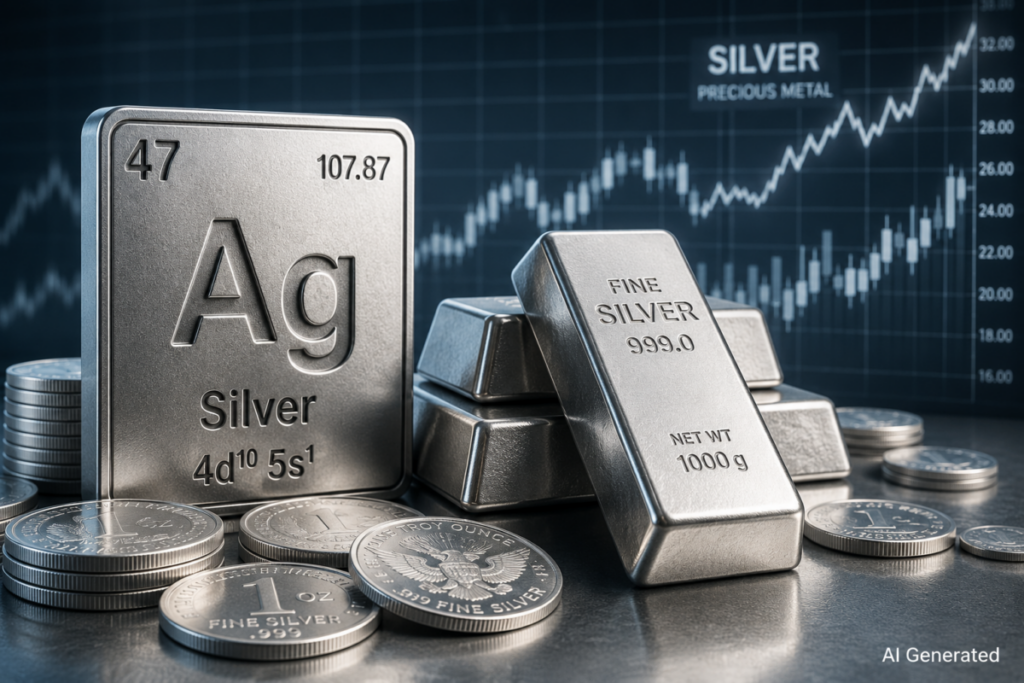
Silver often gets described as “cheap gold.” The label is convenient, but it misses how the market actually prices the metal.
Gold enters portfolios with a fairly clean job: protect purchasing power, absorb crisis risk, offset currency anxiety, and preserve optionality when policy credibility weakens. Silver can serve as monetary protection, too. Its demand base also reaches into solar cells, electronics, vehicles, data-center infrastructure, and power systems.
During a rate-cut scare or dollar sell-off, the marginal buyer often comes from the macro side. Later in the cycle, factories matter.
The gold-silver ratio only gets investors part of the way. The sharper question is which buyer matters most at today’s price.
The Monetary Bid Still Has Teeth
Silver can follow gold when markets focus on real yields, currencies, inflation, or geopolitical risk. Lower real yields reduce the opportunity cost of holding metals. Dollar weakness improves affordability for non-U.S. buyers. Policy uncertainty sends more capital toward hard assets.
The Fed’s June decision, maintaining the federal funds target range at 3.50% to 3.75%, kept that monetary backdrop in focus. The committee cited elevated inflation and uncertainty, partly tied to conflict in the Middle East.
Risk conditions have kept capital moving into metals. The World Bank said gold, platinum, and silver reached record highs in the first quarter of 2026, supported by geopolitical tension and combined speculative and safe-haven demand. Its precious metals index is projected to rise 42% in 2026.
For silver, monetary demand can move fast because positioning often builds through retail coins and ETFs, fast-money accounts, options-linked flows, and gold-beta trades. Price action can look calm for weeks. One dollar move or Fed repricing can change the tone quickly.
Industry Adds A Different Kind Of Pressure
Silver’s industrial side moves on a slower clock. The pressure shows up first in procurement and product design. Manufacturers start asking how much metal they can remove without hurting performance.
Industrial silver fabrication is expected to fall 2% to roughly 650 million ounces, which still leaves the investment case intact. The decline shows where price sensitivity is starting to bite. Solar manufacturers are using less silver per panel and testing substitutes because silver has become a cost line they can no longer ignore. AI-related hardware and automotive demand are adding new sources of consumption, so the demand picture looks uneven, with pockets of growth and visible areas of resistance.
Total global supply is expected to rise 1.5% to 1.05 billion ounces, while mine production is expected to grow only 1% to 820 million ounces. If investment demand strengthens or industrial buying surprises to the upside, the market has little room for error. Estimated at 67 million ounces, the sixth consecutive annual deficit tells investors the market still has a physical constraint beneath the volatility. For portfolio decisions, this physical constraint matters more than the headline direction of one demand category.
Real Yields, PMIs, Inventories, and Solar Costs
When real yields fall and the dollar softens, silver usually gets pulled back into the precious-metals trade. Gold confirmation matters too; silver rallies that track gold closely often reflect monetary demand.
Improving PMIs, stronger copper prices, and better China demand can pull silver toward the industrial side of the commodity market. Inventories, lease rates, bullion premiums, and mine output show whether a supply story has real stress behind it.
Solar complicates the trade. Solar panel producers have intensified efforts to replace silver with alternatives such as copper after silver rallied 130% over the previous year. Silver paste accounts for roughly 30% of total solar cell costs, and photovoltaic demand represents 196 million troy ounces, or 17% of total silver demand.
More solar capacity can absorb more silver, but high prices change behavior fast. Panel makers reduce loadings first. Some move toward copper alternatives or hybrid silver-copper designs. For solar-driven demand, unit growth matters only alongside silver intensity per panel.
Portfolio Positioning Should Follow The Active Driver
For a simple portfolio scenario, take a 5% precious-metals sleeve. When the goal is defense, gold should carry most of that allocation because it has deeper institutional demand and a cleaner store-of-value identity. Silver can sit around it as a smaller, higher-volatility satellite.
The mix can shift toward silver only when the signals stack up: easier rate expectations, dollar weakness, improving PMIs, tight physical supply, and substitution that remains contained. Even then, the position needs stricter sizing than gold. Silver’s beta can add tactical upside when the data confirms the move; late entries get punished quickly. The gold-silver ratio still has value at extremes, but it should be checked against the active driver: monetary stress, industrial demand, physical tightness, or a short-term technical squeeze.
Monetary stress can lift the metal before industrial data improves. Then the harder part begins: strong end-demand may still coincide with manufacturers cutting silver use. Investors should add exposure only when the active driver is visible. Cut back when price action runs ahead of the data. Before treating every solar or AI headline as a demand tailwind, check substitution risk. Silver’s volatility should be assumed before the trade goes on. Position size has to absorb that risk from the start.
Benzinga Disclaimer: This article is from an unpaid external contributor. It does not represent Benzinga’s reporting and has not been edited for content or accuracy.