
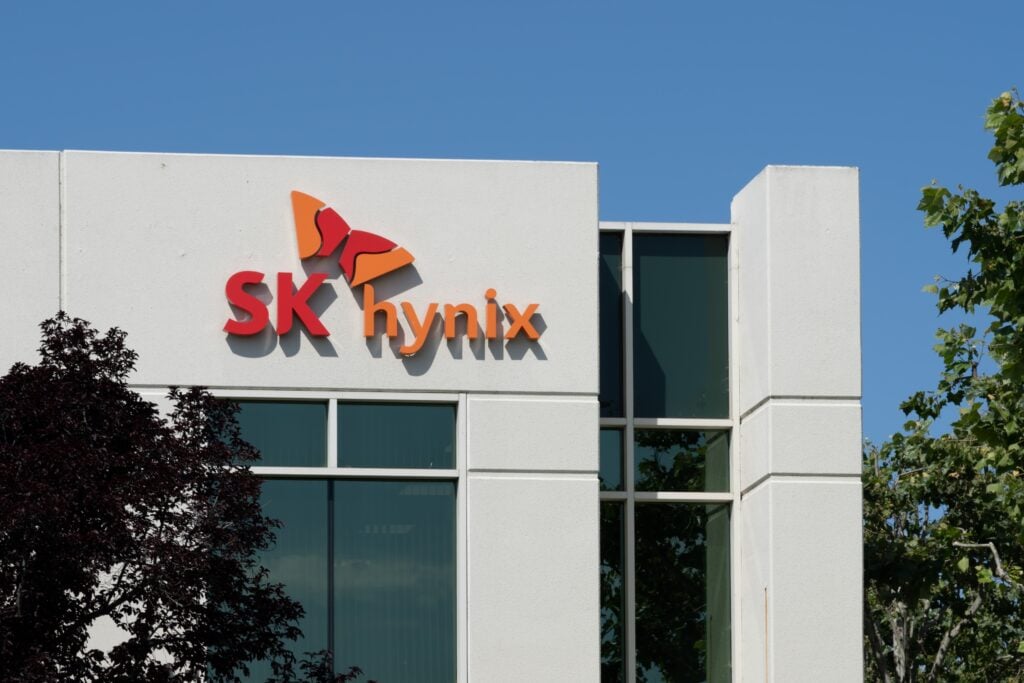
Two leveraged ETFs tied to SK Hynix Inc. (NASDAQ:SKHY) are set to close just three months after launching in the U.S., raising questions about the viability of the growing lineup of single-stock ETFs targeting the artificial intelligence trade.
According to Bloomberg, Tradr ETFs will liquidate the Tradr 2X Long SK hynix Daily ETF (BATS:SKHA) and Tradr 2X Short SK hynix Daily ETF (BATS:SKHN). Both funds began trading on July 28, shortly after SK Hynix launched its ADRs in the U.S.
The funds will trade for the last time on Nov. 5 and, according to the issuer’s announcement, are scheduled to cease operations around Nov. 12.
The closures come amid growing competition among leveraged ETFs offering exposure to SK Hynix, a major supplier of high-bandwidth memory chips used in AI accelerators. ProShares, Direxion, Leverage Shares, T-REX and Corgi have also introduced products targeting the semiconductor company, creating an increasingly crowded market for traders seeking amplified exposure to its shares.
For investors, the key question is whether the two Tradr closures reflect fund-specific challenges or broader pressures as volatility, performance, and trading activity shape demand.
Tradr’s Funds Lose Assets as Performance Diverges
SKHA and SKHN have struggled to retain assets since launch. Their combined assets have fallen more than 60% from their peak to about $1.3 million, according to Bloomberg and Korean media.
The two funds have also delivered sharply different results from their intended daily exposure.
SKHA, which targets twice the daily return of SK Hynix’s ADRs, has declined since its debut. The average trading volume also stands at 8,123. The 30-day median bid-ask spread is almost 0.30%, wider than its peers.
SKHN, which targets twice the inverse of the daily return, has fallen even more sharply. According to the reported figures, SKHA was down more than 13% and SKHN had lost 38% since inception. Average volume stands at 50,522.
The comparison highlights a key feature of leveraged ETFs: their returns depend on the sequence of daily price movements, not simply on whether the underlying stock rises or falls over a longer period.
Which SK Hynix Leveraged ETFs Face the Greatest Pressure?
The other similar funds, namely ProShares Ultra SK hynix (NYSE:SKHU), Corgi SK hynix 2x Daily ETF (BATS:SK), Direxion Daily SK Hynix Bull 2X ETF (NYSE:SKHL), and Leverage Shares 2X Long SK Hynix Daily ETF (BATS:SKHX) differ considerably in size and trading activity. The available data suggest that some have attracted substantially more investor capital than the two Tradr products, while recent price declines highlight the risks of leveraged exposure.
| ETF | Assets / performance | What the data indicate |
|---|---|---|
| ProShares Ultra SK hynix ETF | $41.8 million in net assets; Average volume: 799,789 | Largest documented asset base among the funds compared here. Its 30-day median bid-ask spread was 0.21%. |
| Corgi SK hynix 2x Daily ETF | $16.5 million in fund assets; Price down 51% since inception; Average volume: 530,501; | Significant recent price weakness warrants monitoring, although the available data do not establish a liquidation risk. Its 30-day median bid-ask spread was 0.20%. |
| Direxion Daily SK Hynix Bull 2X ETF | Down 27.58% on a NAV basis since inception; Average volume: 2,111,000 | Negative since-inception performance is a risk indicator, but current assets and trading activity need to be checked before assessing its commercial viability. |
| Leverage Shares 2X Long SK Hynix Daily ETF | NAV is down 41.07% since inception; Average volume: 3,539,157 | Negative since-inception performance is a risk indicator, but liquidity and bid-ask-spread is reasonable. Its 30-day median bid-ask spread was 0.14%, which is reasonably narrow. |
The comparison suggests that SKHU has a materially larger asset base than the liquidating Tradr funds, while Corgi’s recent decline merits closer monitoring. However, price losses alone do not determine whether an ETF will be delisted.
Competition May Be as Important as Market Volatility
Tradr’s decision also comes amid a broader shake-up in single-stock leveraged ETFs. The issuer previously announced the liquidation of five other funds tied to Coupang Inc (NYSE:CPNG), Pony AI Inc (NASDAQ:PONY), NXP Semiconductors (NASDAQ:NXPI), Nuscale Power Corp (NYSE:SMR) and Tower Semiconductor Ltd (NASDAQ:TSEM). Separately, ProShares withdrew registration filings for proposed leveraged ETFs tied to Hyundai Motor and Samsung Electro-Mechanics.
In comments to Seoul Economic Daily, Matt Markiewicz, Tradr’s head of ETF product and capital markets, cited intense competition among similar products as a factor behind the SK Hynix funds’ liquidation. He said he did not believe the decision reflected a problem with SK Hynix as the underlying asset.
That distinction matters. An ETF can close because it fails to attract enough assets to justify its operating costs, even when its underlying stock remains a viable investment. A crowded market can make it harder for smaller products to retain assets, particularly when several funds offer nearly identical daily leveraged exposure.
3 Indicators to Determine Whether Competing Funds Face Similar Pressures
- Shrinking assets: Sustained outflows and falling net assets can make a fund less economical to operate.
- Thin trading and wider spreads: Low turnover and larger bid-ask spreads can raise transaction costs for investors.
- Issuer actions: Liquidation announcements, prospectus supplements and regulatory filings offer firmer evidence of closure plans than weak returns alone.
Leveraged ETFs also carry a separate investment risk. Their daily reset means returns over several weeks or months can differ significantly from twice the underlying stock’s cumulative return. In volatile markets, compounding can erode returns even when the stock’s longer-term direction appears favorable.
Tradr’s planned closures put the economics of SK Hynix-linked leveraged ETFs under scrutiny, but the evidence does not yet establish that another fund is headed for delisting. The next step is to track comparable AUM, fund flows and trading liquidity over time to distinguish temporary market weakness from a more persistent viability problem.
Photo: Shutterstock