
Gold has spent the better part of 2026 in a retracement phase. From an all-time high above $5,600 to a low near $3,942, the selloff wiped out months of gains and tested the patience of every gold bull on the planet. But the structure of that decline – three clean legs down, ending at a level that mattered six months ago – is worth paying close attention to right now.
Six Months of Selling in Three Waves
Gold reached its all-time high of $5,602 on January 29, 2026. What followed was one of the most orderly corrections the metal has seen in years.
The first leg down took gold from $5,600 to a low of $4,402 in early February – a drop of nearly $1,200 in a matter of weeks. Price then bounced sharply, recovering to $5,419 in early March. That was the first lower high: sellers were back in control, and buyers were unable to reclaim the all-time high.
The second leg accelerated. Gold crashed from $5,419 to $4,099 in late March, then bounced again – this time to $4,891 – another lower high. The pattern was becoming clear.
The third and final leg pushed the price to a new low of the year at $3,942 in late June. What made this level significant wasn’t just the number – it was the fact that $3,942 was the November 2025 low, the base from which gold launched its historic rally to $5,600 in the first place. When price returns to a prior structural support and holds, it tells you something. Buyers who missed the original move are stepping in at a level they consider fair value.
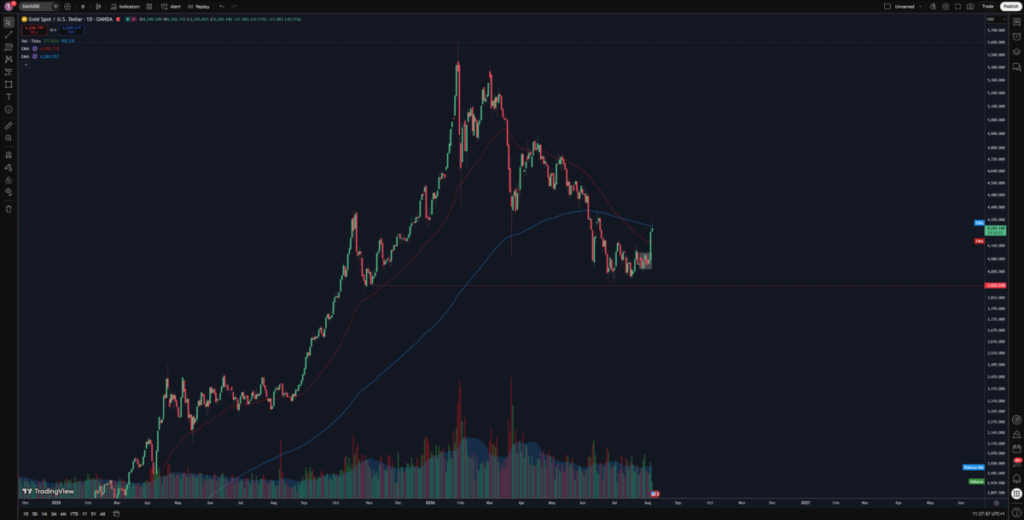
Chart: Created by the author
Why Three-Leg Corrections Matter
In technical analysis, three-wave corrections are significant. They represent a complete cycle of selling pressure: an initial move down, a recovery that fails to reclaim the prior high, and a final leg that exhausts the remaining sellers. What typically follows – when the structure plays out cleanly – is either a resumption of the prior trend or a prolonged consolidation before the next move.
Gold gave us exactly that. After the third low at $3,942, price stopped making new lows. Instead, it entered a multi-week consolidation – a period of indecision that, in this context, reads as distribution giving way to accumulation.
Why $3,942 Matters
This isn’t a random number. It’s the November 2025 low – the exact level from which gold launched its historic rally to $5,600. Price returning to a prior structural support and holding there is one of the clearest signals in price action analysis. It means buyers who missed the original move are stepping back in at a level they consider fair value. That’s not a coincidence. That’s the market respecting its own history.
The hold at $3,942 also coincides with meaningful fundamental support. Central banks continued increasing their gold reserves through mid-2026, with global central bank buying reaching 51.1 tonnes in June alone – China increasing its holdings for the twentieth consecutive month. When price holds at a key technical level, and institutional demand is quietly building underneath, that combination deserves serious attention.
Where We Are Now
Gold is currently trading at $4,305, and the price action is constructive. After holding the $3,942 support and consolidating for several weeks, buyers have pushed the price decisively above two key moving averages on the daily chart.
The 50-day EMA sits at $4,193. The 200-day EMA sits at $4,284. Gold is now trading above both – and crucially, it is holding above the 200-day EMA rather than just briefly spiking through it. That’s a meaningful shift. When price reclaims the 200-day EMA and holds, it signals that the medium-term trend is beginning to favour buyers again.
The next significant resistance level is $4,382. That’s where the real test begins.
The Key Levels to Watch
$4,305 – where gold trades right now. Holding above the 200-day EMA at $4,284, with buyers in control on the short-term timeframe.
$4,382 – the confirmation level. A decisive daily close above here shifts the burden of proof to the bears and signals that the correction is genuinely over, not just paused.
$4,500 – the next significant target. A rally to this level would substantially strengthen the bull case and could mark the beginning of a new trending phase rather than just another recovery bounce.
$3,942 – the line in the sand. A break below the June low invalidates the support thesis entirely and puts the longer-term downtrend back in play.
The NFP Factor
Today’s Non-Farm Payrolls report adds a near-term catalyst to an already interesting technical setup. A softer employment reading would likely ease expectations of further Federal Reserve tightening – reducing the opportunity cost of holding gold and giving buyers the fundamental justification to push through $4,382. A stronger-than-expected number could temporarily cap the rally, but given how firmly gold has held above the 200-day EMA this week, the underlying bid looks real regardless of today’s data.
In other words, the NFP isn’t the thesis – it’s the trigger. The structure was already in place before the report.
My Read
The three-leg structure, the clean consolidation that followed, the hold at November 2025 support, and the reclaim of both the 50 and 200-day EMAs all point in the same direction: the correction is likely over, or very close to it.
That doesn’t mean gold goes straight back to $5,600. Recoveries from corrections rarely move in a straight line, and there will be pullbacks along the way. But the risk-reward has shifted. Above $4,382, the trade is with the buyers. Below $3,942, this entire thesis needs to be reassessed.
The Fed staying on hold, central bank demand holding firm, and a weaker US dollar in recent sessions are all adding fundamental weight to a technical picture that was already improving. Gold has done the hard work of building a base. The question now is whether today’s NFP gives it the push it needs to confirm the next leg higher.
What Could Go Wrong
No analysis is complete without the bear case.
A break below $3,942 would invalidate everything discussed above. It would signal that the correction is not a three-leg structure ending at support – it’s a five-leg structure with more downside ahead.
Fed policy remains the biggest macro risk. If inflation reaccelerates or the labour market stays tighter than expected, the case for rate hikes returns – and rising real yields are historically one of the clearest headwinds for gold.
Finally, three-leg corrections can extend. This reading could be premature. Price action is probabilities, not certainties – and any position in gold right now needs a clearly defined stop below $3,942.
Bottom Line
Gold’s correction from $5,600 to $3,942 has the hallmarks of a complete three-leg pullback. Price held at a major structural support level, consolidated, and has since reclaimed both the 50 and 200-day EMAs. At $4,305 and approaching the $4,382 confirmation level, the setup favours bulls – especially with today’s NFP data potentially acting as a catalyst. Above $4,382, the next target is $4,500. Below $3,942, the thesis is off the table.
FAQs
Has gold found a bottom in 2026?
The three-leg correction from $5,600 to $3,942 appears to have ended at the November 2025 support level. Gold has since reclaimed the 50 and 200-day EMAs and is approaching the $4,382 confirmation level. A break and hold above $4,382 would confirm the correction is over.
What is the gold price outlook for 2026?
Gold is currently trading at $4,305, approaching key resistance at $4,382. A break above this level targets $4,500 and potentially higher. A break below $3,942 would put the bearish case back in play.
What level does gold need to break to resume its uptrend?
The critical confirmation level is $4,382. A decisive daily close above this level signals buyer control and trend resumption. $4,500 is the next significant target beyond that.
Is gold in a bull market?
Gold’s long-term trend remains upward – it rallied from November 2025 lows to an all-time high of $5,602 in January 2026. The 2026 correction appears to be a pullback within that broader trend rather than a trend reversal, but confirmation above $4,382 is needed to validate that view.
Is now a good time to buy gold?
The technical structure favours buyers above $4,382, with $3,942 as a clear invalidation level. Today’s NFP data may act as a near-term catalyst. As always, position sizing and risk management matter more than the entry price. This is not financial advice.
Image Credits: All charts and screenshot in this article were created by the author.
Benzinga Disclaimer: This article is from an unpaid external contributor. It does not represent Benzinga’s reporting and has not been edited for content or accuracy.