Lucid Group Inc. (NASDAQ:LCID) shares are trading lower during Wednesday’s premarket session as traders digest a regulatory filing that helped spark Tuesday’s sharp rally and now appears to be prompting some early profit-taking. Here’s what investors need to know.
- Lucid Group shares are experiencing downward pressure. Why is LCID stock trading lower?
What Does Prince Al Waleed’s Stake Mean for LCID?
A Schedule 13G filing shows Prince Al Waleed bin Talal Al Saud has sole voting and dispositive power over 19,513,000 shares, with the reportable event dated July 23 and the filing signed July 28. The stake was disclosed as a passive investment, indicating no intent to seek board representation or influence operations.
That “passive” framing matters for LCID because it can cool expectations of near-term strategic changes, even as the headline adds a high-profile name to the capitalization table. After an initial 20% spike, the market’s focus is shifting to whether Lucid can hold those gains until its next major catalyst.
Critical Levels to Watch for LCID Stock
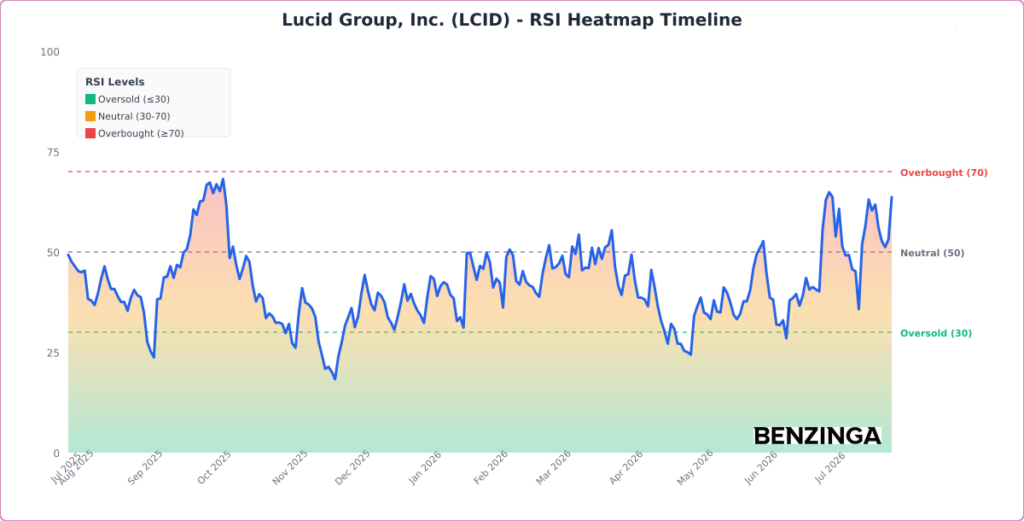
After Tuesday’s surge (shares were up 22.00% to $7.93 at the time of that report), the premarket dip looks more like consolidation than a clean trend break, with the stock still holding above key short- and intermediate-term averages. At $7.77, LCID is trading 21.2% above its 20-day SMA ($6.38) and 30.6% above its 50-day SMA ($5.92), but it remains 24.1% below its 200-day SMA ($10.18), which keeps the longer-term downtrend in the conversation.
MACD is the cleaner momentum lens here: it’s above its signal line and the histogram is positive, which points to improving upside pressure versus the prior downswing. In plain terms, when MACD is above its signal line, it suggests momentum is shifting in buyers’ favor—even if the bigger-picture trend hasn’t fully reset.
The moving-average structure is mixed: the 20-day SMA is above the 50-day SMA (a bullish near-term crossover), while the 50-day SMA is still below the 200-day SMA (a bearish longer-term backdrop). Key turning points also underline the volatility—there was a 52-week low in July, followed by a recent swing high and swing low in July, which is typical of a stock trying to base after a long drawdown.
- Key Resistance: $10.18 — the 200-day SMA is the main “line in the sand” overhead after the multi-month downtrend
- Key Support: $7.12 — near the 100-day SMA, a logical first test if the post-spike pullback deepens
LCID Stock Price Movement During Premarket
LCID Stock Price Activity: Lucid Group shares were down 2.15% at $7.73 during premarket trading on Wednesday, according to Benzinga Pro data.
Image: Shutterstock