Rocket Lab Corp (NASDAQ:RKLB) shares are trading lower on Tuesday as traders digest last week’s deal-driven run-up and rotate out of higher-beta space names during a risk-off tape.
- Rocket Lab stock is feeling bearish pressure. Why is RKLB stock dropping?
What Is Driving Rocket Lab’s Recent Stock Movement?
The stock’s recent narrative has been fueled by NASA’s June 25 selection of the company for three Electron launches (PolSIR and TSIS-2) and a June 29 definitive agreement to acquire Iridium Communications in a cash-and-stock deal priced at $54 per share (about $8.0 billion enterprise value). With that burst of new information already priced in by many traders, Tuesday’s move looks like a reset as the market re-sorts winners and trims higher-beta exposure.
Rocket Lab’s NASA win also came with concrete timing traders have leaned on: TSIS-2 was booked to launch in just seven months from contract signing, while PolSIR is slated for two back-to-back Electron launches from New Zealand no earlier than June 2027.
The Iridium tie-up adds scale, Iridium has more than 2.55 million active subscribers, and reported $871.7 million in revenue and $495 million in OEBITDA at a 57% margin in 2025, which helps explain why the stock ripped before profit-taking hit.
Critical Levels To Watch For RKLB Stock
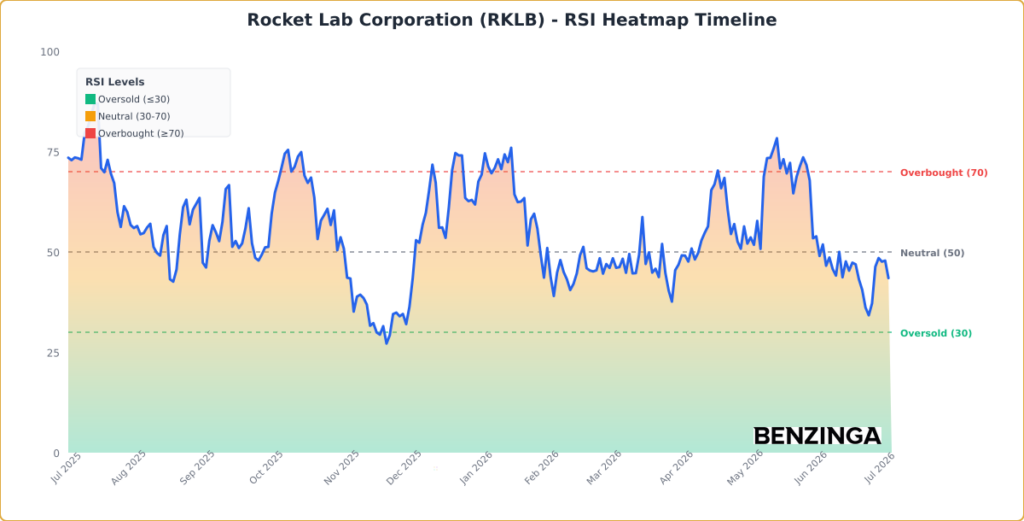
From a longer-term trend view, RKLB is still up 116.96% over the past 12 months and remains above its 200-day SMA ($76.29), but the near-term structure has weakened after the recent swing high in May (which also marked the 52-week high at $151.00). The stock is trading 15.4% below its 20-day SMA ($99.84) and 21% below its 50-day SMA ($106.99), and the 20-day SMA sitting below the 50-day SMA keeps the short-term trend tilted bearish.
Momentum also suggests rallies may be harder to sustain right now: MACD is below its signal line and the histogram is negative, which typically means upside pressure is fading versus the prior upswing unless buyers can reclaim that baseline. In plain English, MACD compares faster and slower trend forces—when it’s below the signal line, rebounds often stall until momentum improves.
Key levels are getting closer after the selloff, and they matter because they line up with nearby baselines and round-number psychology.
- Key Resistance: $93.00 — a nearby rebound zone that also sits near the 100-day SMA/EMA area, where overhead supply can show up
- Key Support: $80.00 — a round-number floor that’s close enough to attract dip-buyers if the pullback continues
Rocket Lab Earnings Preview for August 2026
Looking further out, the next major catalyst for the stock arrives with the August 6, 2026 (estimated) earnings report.
- EPS Estimate: Loss of 7 cents (Up from Loss of 13 cents YoY)
- Revenue Estimate: $231.79 million (Up from $144.50 million YoY)
Analyst Consensus & Recent Actions: The stock carries a Buy rating with an average price target of $104.73 (high: $135.00, low: $60.00) across 27 analysts. Recent analyst moves include:
- B of A Securities: Buy (Raises Target to $115.00) (June 30)
- Cantor Fitzgerald: Overweight (Maintains Target to $96.00) (June 30)
- Citizens: Market Outperform (Raises Target to $130.00) (June 30)
RKLB Stock Price Movement on Tuesday
RKLB Stock Price Activity: Rocket Lab shares were down 10.01% at $83.77 at the time of publication on Tuesday, according to Benzinga Pro data.
Image: Shutterstock