Historical data suggests the rally on Wall Street may be far from over.
After a sluggish start to the year, the S&P 500 — as tracked by the SPDR S&P 500 ETF Trust (NYSE:SPY) — staged an impressive rebound in the second quarter, surging nearly 15%.
That places 2026 among the strongest second-quarter performances since 1950, a rare occurrence that has historically been followed by further gains rather than exhaustion.
That rarity is exactly what makes the setup worth watching.
What History Says After A 10% Rally In Q2
Ryan Detrick, chief market strategist at Carson Group, tracks every instance back to 1950, and the nine prior cases point in one direction.
Years in which the S&P 500 gained more than 10% during the second quarter have almost always led to a positive finish for the remainder of the year.
The final six months of the year finished higher eight times out of nine, an 88.9% hit rate, and averaged a gain of 11.7%.
| Date of Quarter End | Q2 Return | Q3 Return | Q4 Return | Final Six Months |
|---|---|---|---|---|
| 6/30/1955 | 12.2% | 6.4% | 4.1% | 10.8% |
| 6/28/1968 | 10.4% | 3.1% | 1.2% | 4.3% |
| 6/30/1975 | 14.2% | -11.9% | 7.5% | -5.3% |
| 6/30/1980 | 11.9% | 9.8% | 8.2% | 18.8% |
| 6/30/1997 | 16.9% | 7.0% | 2.4% | 9.6% |
| 6/30/2003 | 14.9% | 2.2% | 11.6% | 14.1% |
| 6/30/2009 | 15.2% | 15.0% | 5.5% | 21.3% |
| 6/30/2020 | 20.0% | 8.5% | 11.7% | 21.2% |
| 6/30/2025 | 10.6% | 7.8% | 2.3% | 10.3% |
| 6/30/2026 | 14.9% | ? | ? | ? |
| Average | 5.3% | 6.1% | 11.7% | |
| Median | 7.0% | 5.5% | 10.8% | |
| % Higher | 88.9% | 100.0% | 88.9% |
“Momentum is real,” Detrick said Monday on X, noting that there have been 41 instances since 1950 in which the S&P 500 gained more than 10% in a single quarter.
In those cases, the index moved higher over the following quarter and over the next two quarters 85% of the time, while the median return over the subsequent 12 months was 13.4%, underscoring that strong market momentum has historically tended to persist rather than fade.
Why Strong Q2 Tends To Beget Strong Halves
The instinct is to read a double-digit quarter as borrowed performance that must be repaid. The data argues the opposite.
A move that large reflects broad participation and improving earnings expectations, and such momentum tends to feed on itself rather than reverse.
The contrast with an ordinary year makes the case. Across all years since 1950, the final six months averaged just 4.9% and closed higher only 72.4% of the time. A second quarter above 10% roughly doubles both the typical return and the odds of a positive finish.
The largest follow-throughs, tellingly, came out of the deepest fear.
After the 15.2% second quarter of 2009, the index gained 21.3% into year-end, and the 20% surge of 2020 was trailed by 21.2%.
The most recent precedent is milder but reassuring. Last year’s 10.6% second quarter was followed by a 10.3% second half, almost exactly the historical average.
Comparison: Strong Q2 Years vs. All Years Since 1950
| Metric | Strong Q2 (>10%) | All Years Since 1950 |
|---|---|---|
| Average Q3 Return | 5.3% | 0.8% |
| Average Q4 Return | 6.1% | 4.2% |
| Average Final Six Months | 11.7% | 4.9% |
| Median Final Six Months | 10.8% | 6.3% |
| Positive Final Six Months | 88.9% | 72.4% |
Can History Repeat?
Of course, historical performance does not guarantee future results.
Markets continue to face several uncertainties, including the Federal Reserve’s policy path, inflation dynamics, corporate earnings, fiscal policy, and geopolitical risks.
Still, if 2026 ultimately follows the historical playbook, investors could see another double-digit advance before year-end.
A gain close to the historical average of 11.7% during the second half would lift the S&P 500 to 8,400 points.
While no market cycle is identical, history suggests that after an exceptionally strong second quarter, betting against momentum has rarely been a winning strategy.
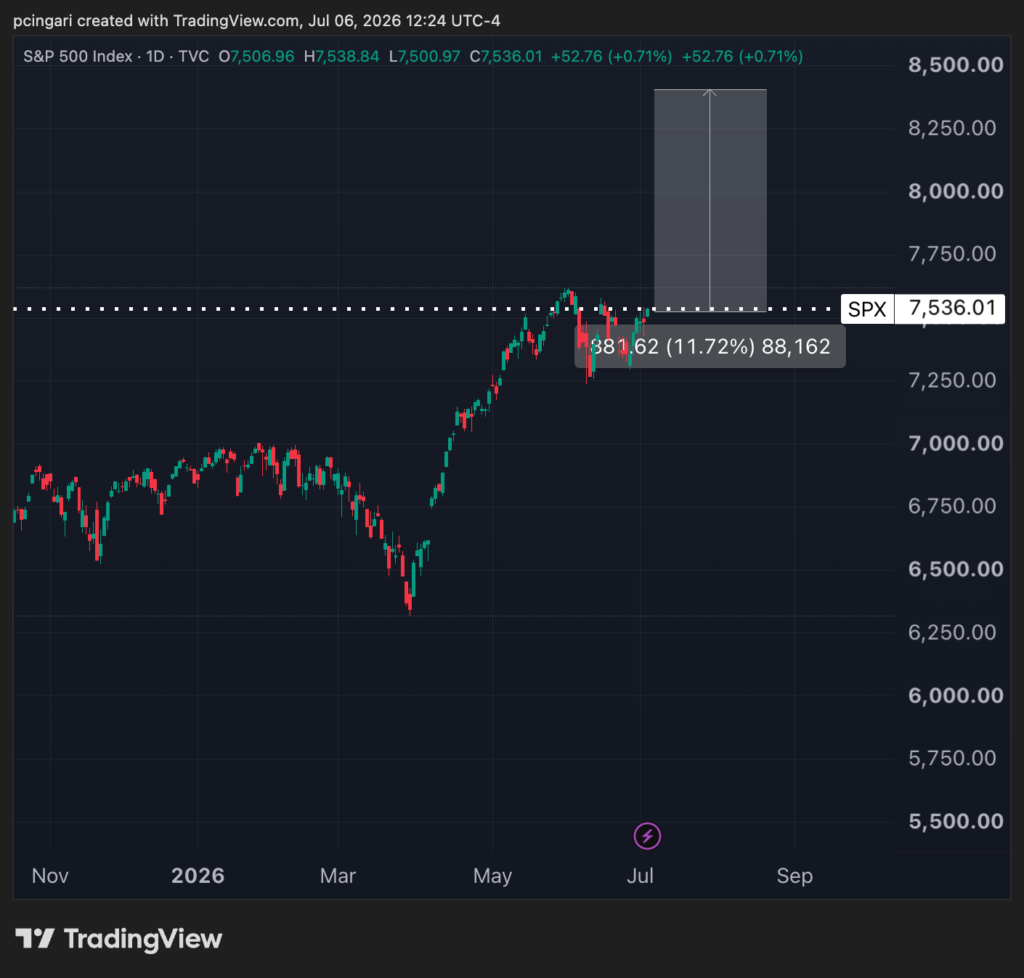
Image: Shutterstock