Starbucks Corp (NASDAQ:SBUX) shares are trading lower by more than 3% on Monday, despite a lack of company-specific news for the session. Here is a breakdown of the key chart levels and support zones to watch as the stock tests its near-term ranges.
- Starbucks stock is under selling pressure. Why is SBUX stock retreating?
Critical Price Levels To Watch for SBUX
From a longer-term trend view, the stock is still holding above its 200-day SMA ($92.83) and 100-day SMA ($99.09), but it’s slipping back under the 50-day SMA ($102.05) and sitting near the 20-day SMA ($101.15), which often signals a choppier, range-bound phase rather than a clean uptrend. The 20-day SMA being below the 50-day SMA is a bearish crossover that can keep rallies capped until price can reclaim those shorter averages.
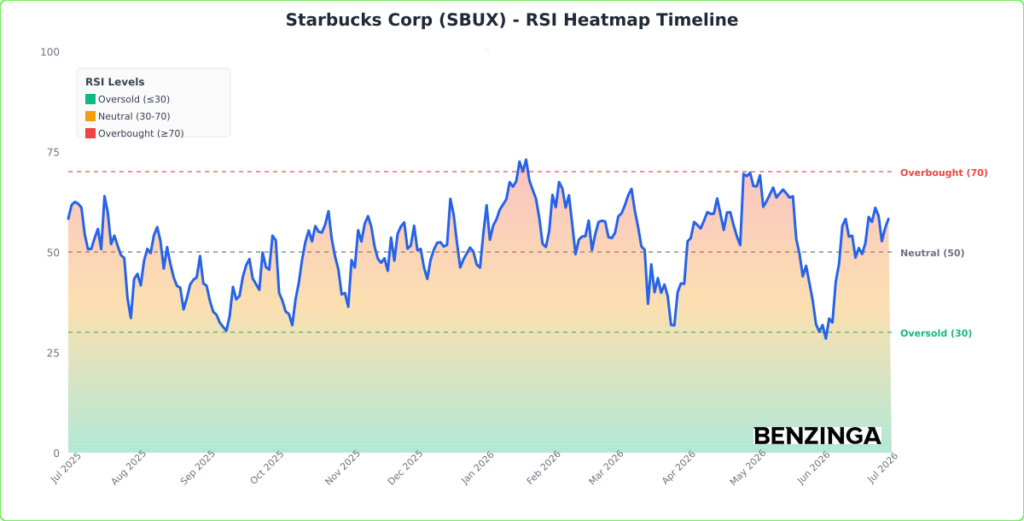
RSI is the cleaner momentum read right now: at 49.04, it’s neutral, meaning the tape isn’t stretched enough to imply a forced snapback either way. In plain terms, RSI helps gauge whether recent buying or selling has become “too far, too fast,” and this reading points to consolidation risk rather than an extreme.
- Key Resistance: $103.50 — a nearby ceiling that lines up with the area above the 50-day SMA where rebounds can stall
- Key Support: $93.50 — a nearby floor closer to the 200-day trend zone where buyers have previously shown up
What Makes Starbucks the Leading Coffee Brand?
Starbucks stands out as the world’s biggest and most recognizable coffee brand, powered by ultracustomizable beverages in-store and a sweeping footprint of nearly 41,000 cafes in over 80 countries. About 52% are company-operated, with the balance run by licensees.
The company earns across its North America (74% of revenue as of the end of fiscal 2025), international (21%), and channel development (5%) segments, including royalties, product/equipment sales, ready-to-drink, and packaged coffee. That scale is why a localized controversy like the Starbucks Korea episode can still matter to the stock—investors tend to treat brand trust and risk controls as part of the long-term moat.
Starbucks Earnings Preview for July 2026
Looking further out, the next major catalyst for the stock arrives with the July 28, 2026 (estimated) earnings report.
- EPS Estimate: 65 cents (Up from 50 cents YoY)
- Revenue Estimate: $9.16 Billion (Down from $9.46 Billion YoY)
- Valuation: P/E of 79.6x (Indicates premium valuation relative to peers)
Analyst Consensus & Recent Actions: The stock carries a Buy rating with an average price target of $106.62. Recent analyst moves include:
- TD Cowen: Upgraded to Buy (Raises Target to $120.00) (May 14)
- Stifel: Buy (Raises Target to $117.00) (May 6)
- UBS: Neutral (Raises Target to $105.00) (April 29)
Starbucks Benzinga Edge Rankings Explained
Below is the Benzinga Edge scorecard for Starbucks, highlighting its strengths and weaknesses compared to the broader market:
- Momentum: Moderate (Score: 69.05) — The stock is holding up reasonably well on a multi-month basis, but today’s drop shows momentum can fade quickly on headlines.
- Value: Weak (Score: 16.59) — A premium-style valuation profile leaves less room for error when sentiment turns.
- Growth: Weak (Score: 17.51) — The market is not pricing Starbucks as a high-growth story right now, which can limit upside without clear catalysts.
The Verdict: Starbucks’s Benzinga Edge signal reveals a momentum-leaning setup with weak value and growth scores, which can make the stock more sensitive to negative headlines. For longer-term bulls, the cleaner technical tell is whether price can reclaim the $103.50 area; otherwise, traders may keep focusing on downside levels like $93.50.
SBUX Stock Price Activity on Monday
SBUX Stock Price Activity: Starbucks shares were down 2.94% at $101.20 at the time of publication on Monday, according to Benzinga Pro data.
Image: Shutterstock